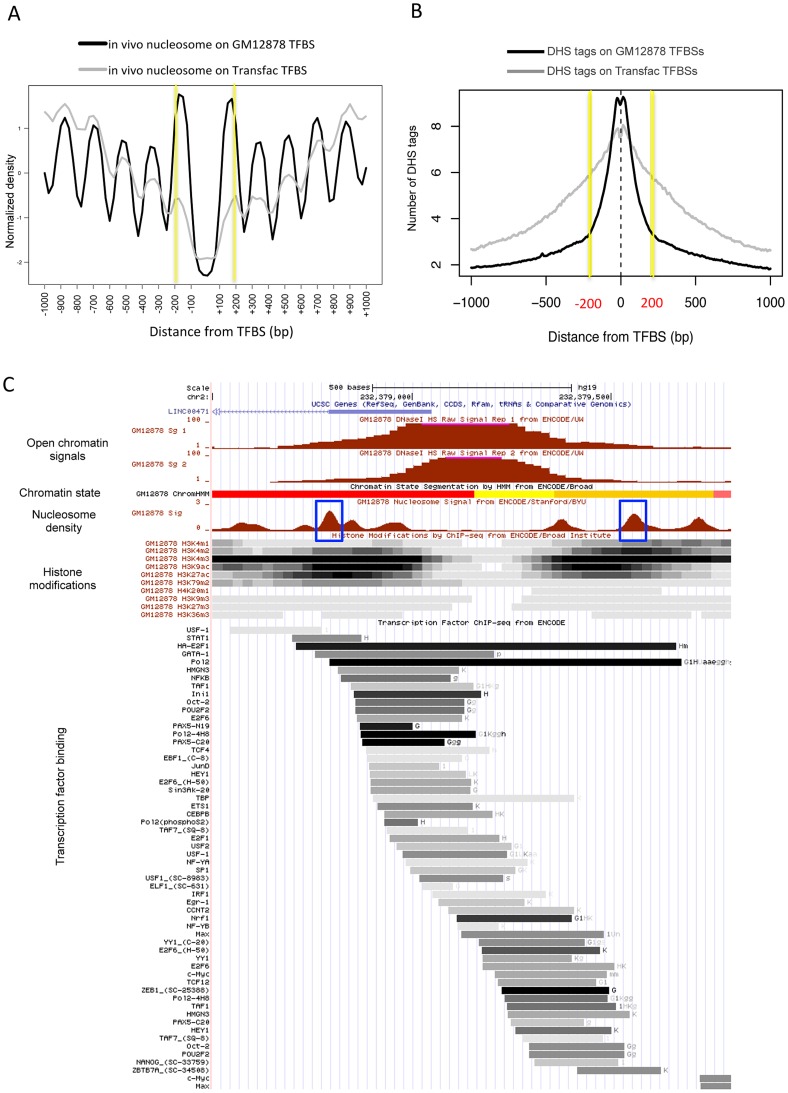
Figure 2. Boundary nucleosome positioning within open chromatin.
(A) Superposition of in vivo and in vitro nucleosomes surrounding the in vivo TFBSs (black curve) and sequence-predicted Transfac TFBSs (gray curve). (B) Number of DHS tags mapped to the region centered on the in vivo TFBSs (black curve) and sequence-predicted Transfac TFBSs (gray curve). (C) Chromatin structure in GM12878 at a genomic locus (chr2:232,378,500–232,379,800). Shown from top to bottom are tracks for open chromatin density (two replicates), chromatin states (red: active promoter, yellow: weak enhancer, and orange: strong enhancer), nucleosome density (blue box: boundary nucleosomes), histone modifications (density shown on the gray scale with dark indicating dense modifications), and TF binding locations (binding affinity shown on the same gray scale as above).

