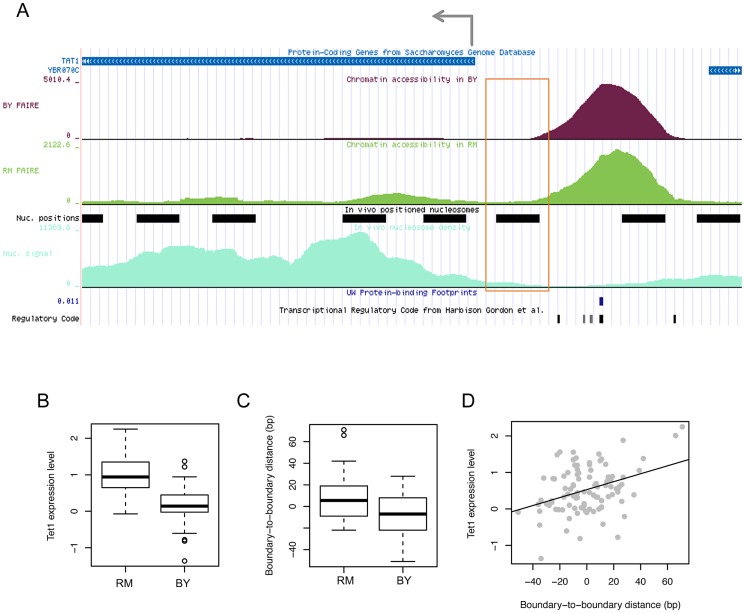
Figure 5. Effects of chromatin border regulation on nearby gene expression.
(A) FAIRE density in the BY4716 (BY) and RM11_1a (RM) strains for accessible chromatin located upstream of the tss of the TAT1 gene is shown above the positioned nucleosomes (black bars) identified based on nucleosome density (light green below). The FAIRE region was supported by DNase I-based protein-binding footprints (blue tick) and the regulatory code track at the bottom displaying the location of TFBSs (black ticks). The left-side border of the FAIRE peak (orange box) was associated in cis with local genotypes, which were also associated with the expression level of TAT1. (B) The gene expression level in strains with the RM genotype and BY genotype. (C) The distance of the left-side border in each strain with the RM or BY genotype relative to that in the BY4716 strain. (D) Correlation between the gene expression level of TAT1 and the boundary-to-boundary distance of the left border of the FAIRE peak across the 96 strains.

