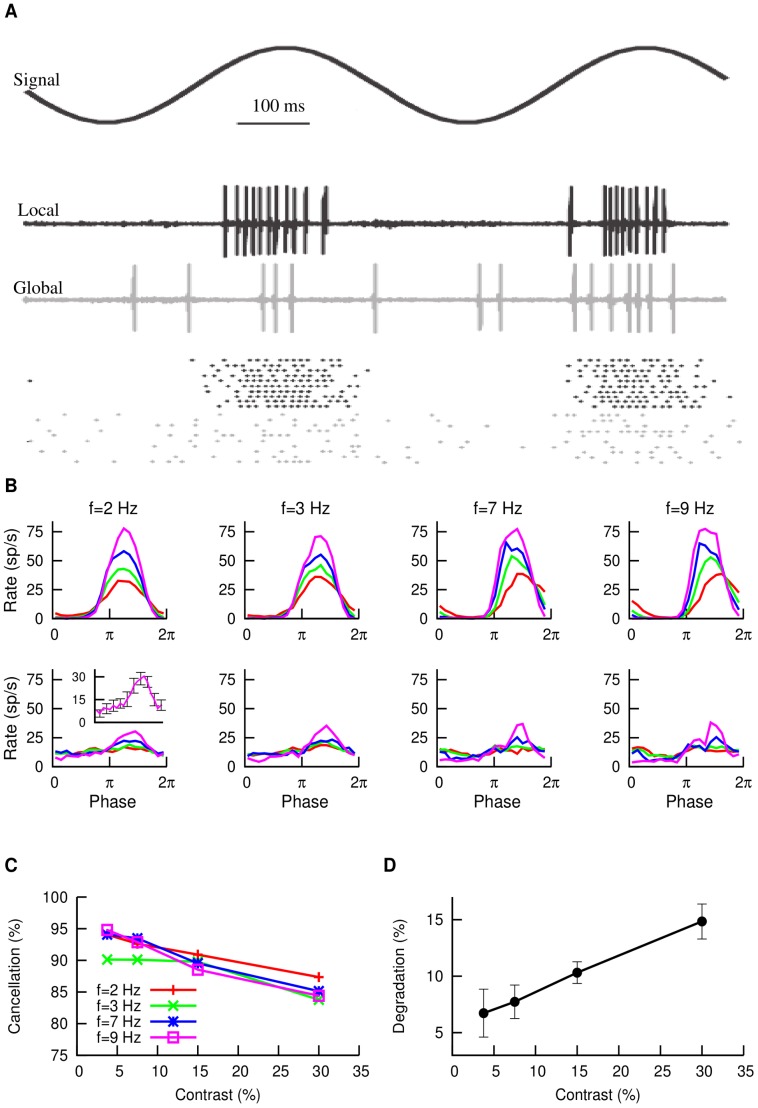
Figure 1. In vivo electrophysiological observations.
(A) Response of SP cells to AM stimuli, for the case in which the signal is local (black) or global (gray). For each case, a single extracellular recording trial and a raster plot are shown. (B) Cancellation of global stimuli for different AM frequencies. Upper row corresponds to local stimulation while lower row corresponds to global stimulation. In each panel, the mean PSTH ( neurons from several fish) for contrasts of
  (red),
  (green),
  (blue) and
  (violet) is displayed. The inset in the lower left panel shows the extent of the typical error bars for one of these curves (
 ). (C) Percentage of cancellation as a function of input contrast, for different AM frequencies. (D) Degradation of the signal cancellation, averaged over all AM frequencies considered, as a function of input contrast.

