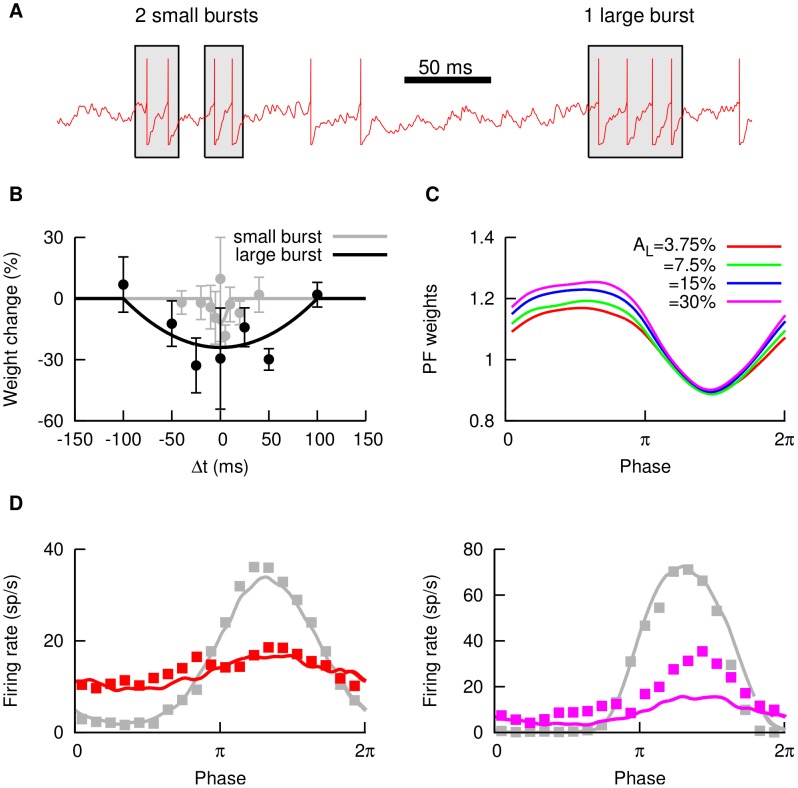
Figure 3. Parallel fiber weights and learning contrast.
(A) Example of small and large bursts as defined in the text. Two spikes occurring within a  window constitute a small burst, whereas four spikes within
  constitute a large burst. (B) Burst-driven learning rules for small and large bursts, as a function of the timing
  of the presynaptic and postsynaptic bursts. Points indicate data from in vitro recordings (taken from [23], each point being averaged over
  trials in the experimental plasticity protocol), and lines are the fit employed in the model. (C) PF weights as a function of the stimulus phase, for different learning contrasts
  . (D) Firing rate of the SP cell as a function of the stimulus phase, for local (gray) and global (colored) stimulation. The learning contrast was set at
  and the test contrast was
  (left panel) or
  (right panel). For both panels, lines correspond to model predictions and points to experimental data shown previously in Fig. 1B.

