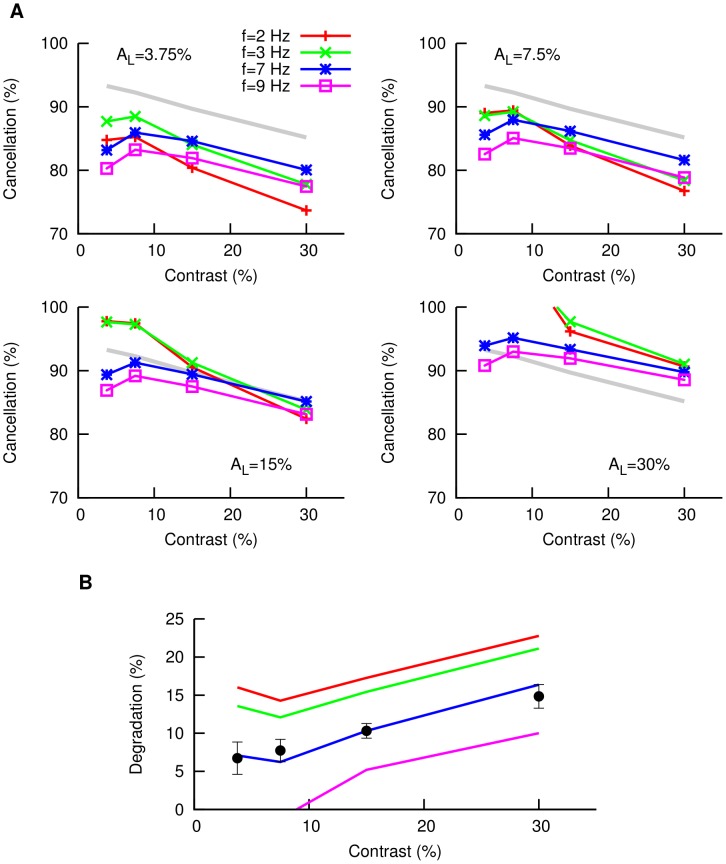
Figure 5. Cancellation of global stimulus with feedback saturation.
(A) Model predictions of the level of cancellation of global signals as a function of contrast, for different signal AM frequencies (colored lines) and different learning contrasts considered (different panels). We have introduced here a factor  which takes into account the saturation of the feedback pathway for high stimulus contrasts. The gray line indicates the frequency-average cancellation levels measured experimentally (from data in Fig. 1C). (B) Degradation level (defined as the quantity
  , once frequency is averaged) as a function of the contrast for different learning contrasts (red
  , green
  , blue
  , violet
  ). Symbols denote experimental data. As we can see, the optimal learning contrast is around
  .
.

