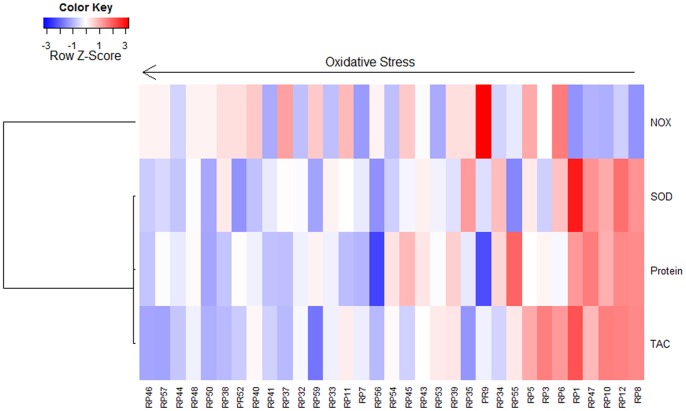
Figure 4. Heatmap representation of the fuzzy clustering results for antioxidant-oxidant markers in aqueous humor of RP patients.
The dark red to dark blue colors correspond to high to low values. Individuals classified as with higher oxidant status show low TAC, protein and SOD3 levels and medium to high NOX levels. Individuals classified as with lower oxidant status show low NOX levels and high SOD3, protein and TAC levels.

