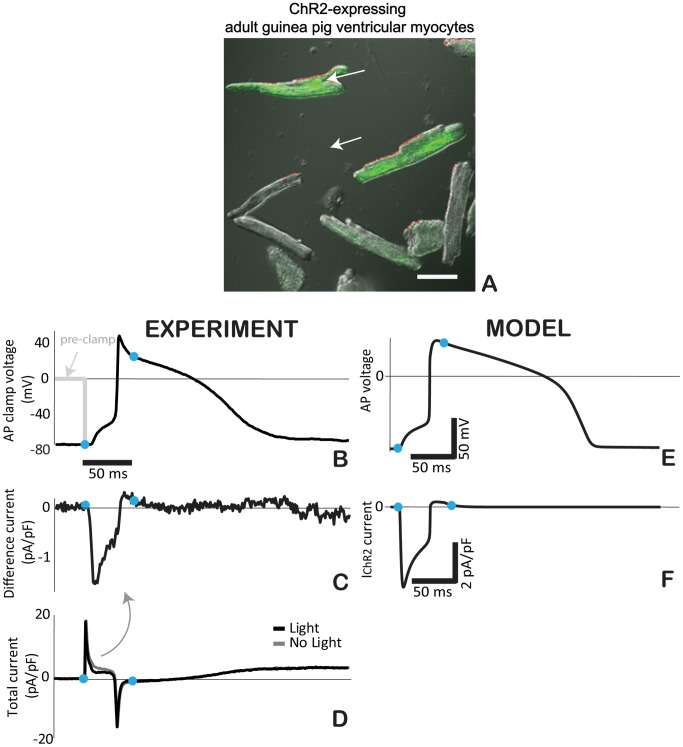
Figure 6. ChR2 current during the cardiac action potential via AP clamp.
A. Adult guinea pig ventricular cardiomyocytes after 48 h of viral infection with Ad-ChR2(H134R)-EYFP, green fluorescence indicates ChR2 expression; scale bar is 50 µm. Experimental (B–D) and modeling (E–F) traces for guinea pig ventricular cells. B. Optically-triggered action potential (50 ms pulse at 470 nm, 1.5 mW/mm2) used for the AP clamp; dotted line indicates the voltage clamp conditions upon application of the waveform; blue dots indicate the beginning and end of the optical pulse. C. Extracted IChR2 as the difference current from the total current traces (panel D) recorded in dark conditions and with a light pulse. E. Analogous optically-triggered action potential in a model of a guinea pig ventricular cell. F. The underlying IChR2 according to the model.

