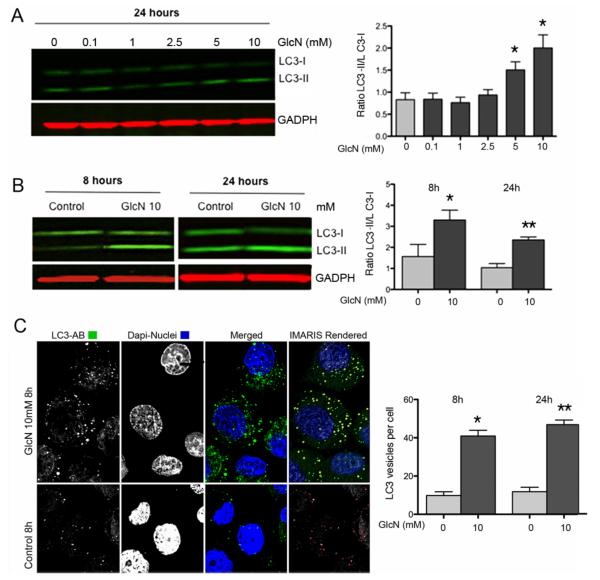
Figure 1. GlcN and autophagy activation in human articular chondrocytes.
A, Normal human chondrocytes were untreated (DMEM 2% CS) or treated with GlcN (0.1, 1, 2.5, 5 and 10 mM) for 24 h. Total protein was analyzed by western blotting using anti-LC3 and GAPDH. Values represent mean ± SD of three separate experiments, * = P < 0.01 vs. control. Bar graphs show quantification of western signals expressed as LC3II/LC3I ratios. B, Normal human chondrocytes were untreated (DMEM 2% CS) or treated with GlcN (10 mM) for 8 or 24 h. LC3 was analyzed by western blotting. C, Normal human chondrocytes were untreated (DMEM 2% CS) or treated with GlcN (10 mM) for 8 and 24 hours stained with anti-LC3 and analyzed by confocal microscopy. The right-upper panel series represents a 3D IMARIS rendered reconstruction of the left-panels. The right-bottom panel represents vesicles that were outlined by Image Pro software (outlined in red) for quantification of vesicles. Magnification: 63x. The bar graph shows quantification of LC3-positive vesicles at 8 and 24 hours.

