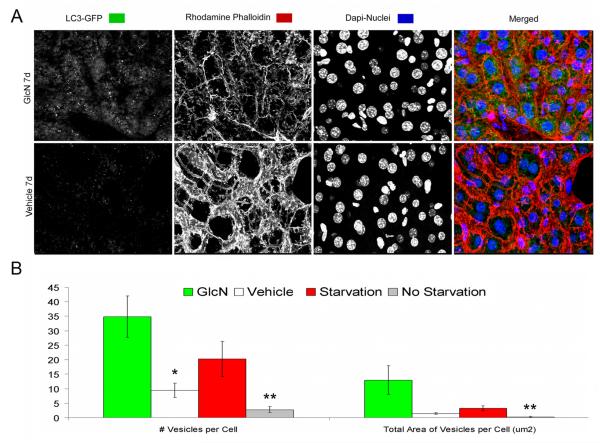
Figure 4. Identification and quantification of autophagosomes in the livers of GlcN treated and food restricted mice.
GFP-LC3 transgenic mice were treated with vehicle or GlcN (250 mg/kg body weight/day) for 7 days by i.p. injection or subjected to food restriction for 48 h to activate autophagy. Induction of autophagy was analyzed in vibratome-cut sections by confocal microscopy. A, Representative images of GFP-LC3 were stained with Rhodamine Phalloidin and Hoechst 33342 to label F-actin and nuclei, respectively. Two sets of control mice were included: vehicle treated or normal-fed GFP-LC3 mice, to provided a baseline for autophagic activity in the liver and a wild-type C57BL/6 mice to determine the background level of green fluorescence. B, Quantitative analysis of vesicles (autophagosomes) in hepatocytes, including the total number of vesicles per cell and the total area of vesicles per cell (μm2). GlcN treatment: * = P < 0.05 vs. vehicle; Starvation: ** = P < 0.05 vs. non starvation. Vehicle indicates standard diet without GlcN. Values represent average ± SEM of four animals per group. Magnification: 63x.

