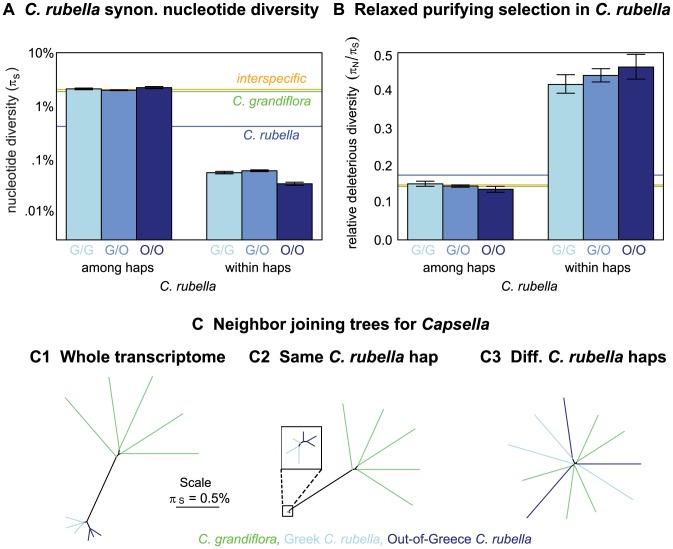
Figure 3. Variation within and among C. rubella's founding haplotypes.
A) Pairwise nucleotide diversity ( ) within and among C. rubella's founding haplotypes at synonymous sites (see Table S3 for values). B) Ratio of nucleotide diversity at non-synonymous relative to synonymous sites (
 ) within and among C. rubella's founding haplotypes. Error bars mark the upper and lower 2.5% tails and are generated by resampling blocks assigned to different (left hand side) or same (right hand side) founding haplotypes. In the top panel (A and B), orange, green, and blue horizontal lines are drawn for reference to interspecific comparisons, comparisons within C. grandiflora, and genome-wide C. rubella comparisons, respectively (taken from Table 1). C) Neighbor joining trees in Capsella, using all comparisons (C.1), comparisons within (C.2), or among (C.3) founding haplotypes to generate entries in the pairwise distance matrix for comparisons within C. rubella. All distances are generated from nucleotide diversity at synonymous sites.

