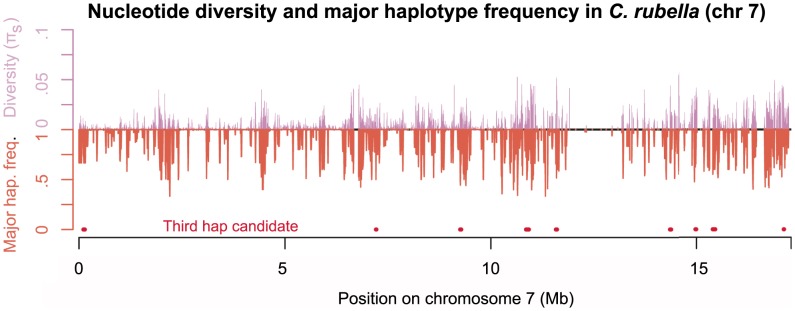
Figure 4. Diversity across chromosome seven in C. rubella.

Mean pairwise synonymous diversity (purple, upward pointing lines) and major founding haplotype frequency (orange, downward pointing lines) across chromosome seven. Red points mark regions putatively containing more than two extant founding haplotypes. Values of  and major founding haplotype frequency are averaged across overlapping sliding windows (ten kb windows with a two kb slide), here only windows with data for
  sites of pairwise comparisons are evaluated. See Figure S7, for plots of all chromosomes.
