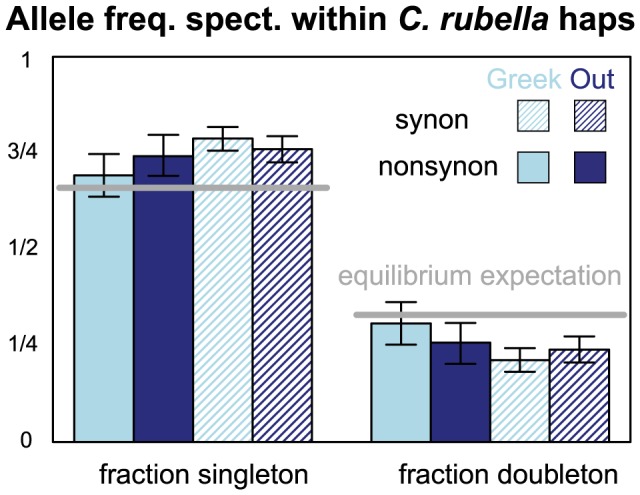
Figure 5. The allele frequency spectrum within C. rubella's founding haplotypes.

The proportion of polymorphic derived alleles within a founding haplotype observed as singletons or doubletons, split by geography and synonymy. Light and dark blue represent comparisons within Greek and Out-of-Greece samples, respectively. Filled and hatched bars represent synonymous and non-synonymous sites, respectively. Error bars represent the upper and lower 2.5% tails of the allele frequency spectrum when founding haplotypes are resampled with replacement. Grey lines represent expectations of a model for neutral mutations at mutation-drift equilibrium.
