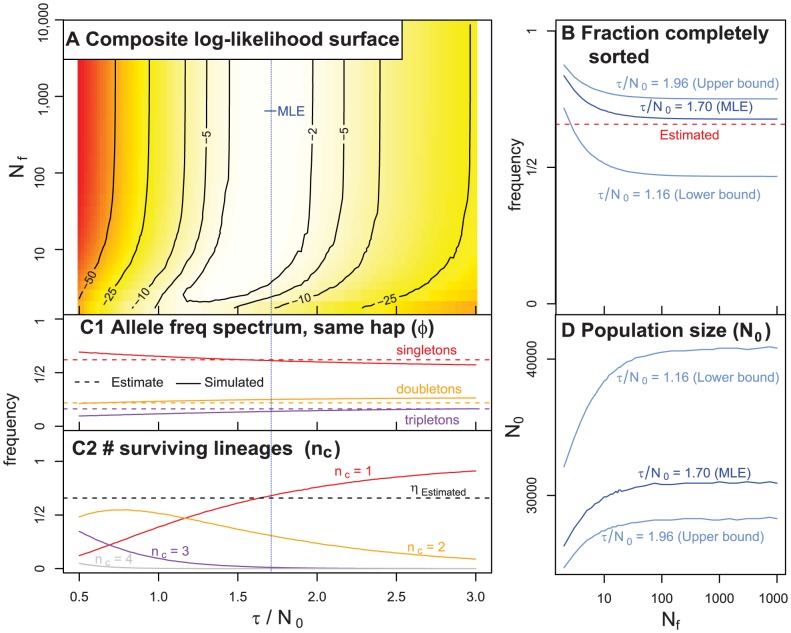
Figure 6. A summary of our coalescent model of the history of C. rubella.
A) The relative composite log-likelihood surface as function of  and
and  . B) The probability that all individuals coalesce to the same founding haplotype (
 ) as a function of
  and three estimates of values
  (the MLE, lower and upper confidence intervals). The dotted red line indicates the value of (
 ) directly estimated from the data. C) A summary of simulation results (assuming
  ). C1) The frequency of singletons, doubletons, and tripletons observed in simulation (full lines), and estimated from our data (dashed lines) conditional on all four samples deriving from the same founding haplotype. C2) The frequency of one, two, three or four lineages surviving to the founding event. When
  is large,
  is the probability that all samples coalesce to the same founding haplotype. The dotted black line portrays the estimated frequency of all four samples residing on one founding haplotype
  . D) The estimated current effective number of chromosomes in C. rubella (
 ) as a function of the number of founding chromosomes (
 ). We plot this for three different values of
  (the MLE, as well as the lower and upper confidence intervals). These results are robust to haplotype labeling criteria in Figure 6 (see Text S1, Figure S6).

