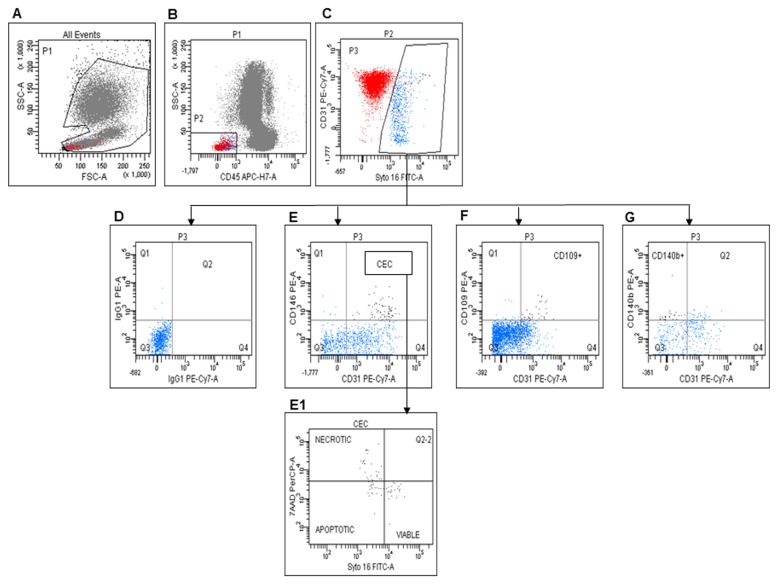
Figure 1. CEC evaluation by flow cytometry.
A: Gate used to exclude cell fragments and debris. B: Gate made to identify CD45- cells. C: CD31 expression and Syto16 staining in CD45- cells. D: Negative control for E (CD31+ CD146+, CECs), F (CD31+ CD109+ CECs) and G (CD31-CD140b+, PPCs). E1: Distribution of viable, apoptotic, and necrotic CECs.

