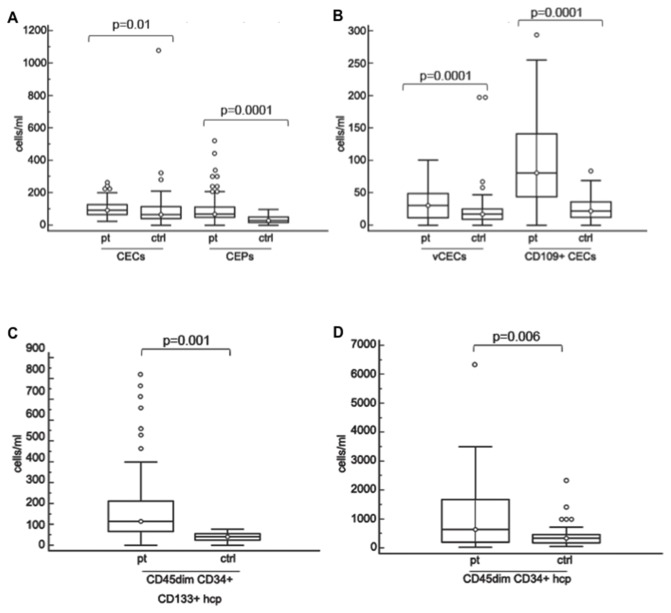
Figure 3. Baseline levels of cell subpopulations in patients treated with bevacizumab and irinotecan and healthy controls.
A: Baseline levels of CECs and CEPs in patients and healthy controls. B: Baseline levels of viable CECs and CD109+ CECs in patients and healthy controls. C: Baseline levels of CD45dimCD34+CD133+ hematopoietic progenitors in patients and healthy controls. D: Baseline levels of CD45dimCD34+ hematopoietic committed progenitors in patients and healthy controls.
Boxes: the interquartile range; lines: location of first quartile, median, and third quartile; ○, outliers beyond the standard span. All P values were calculated by the Mann-Witney test. Abbreviations: CECs, circulating endothelial cells; vCECs, viable CECs; CEPs, circulating endothelial progenitors; ctrls, healthy controls; hcp, hematopoietic committed progenitors.

