
Figure 4.
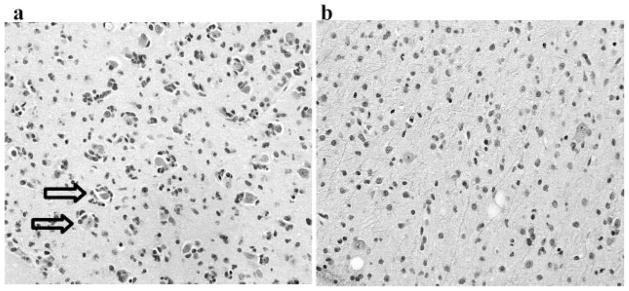
H&E staining for patient with (a) grade II oligodendroglioma, which tend to have an infiltration pattern of perineuronal satelitosis and more persistent neurons as shown by the arrows, whereas patients with (b) grade II astrocytoma tend to have a diffuse infiltration pattern. This may help explain the lower ADC and higher FA values in oligodendrogliomas and higher ADC and lower FA values in astrocytomas.