
Figure 3.
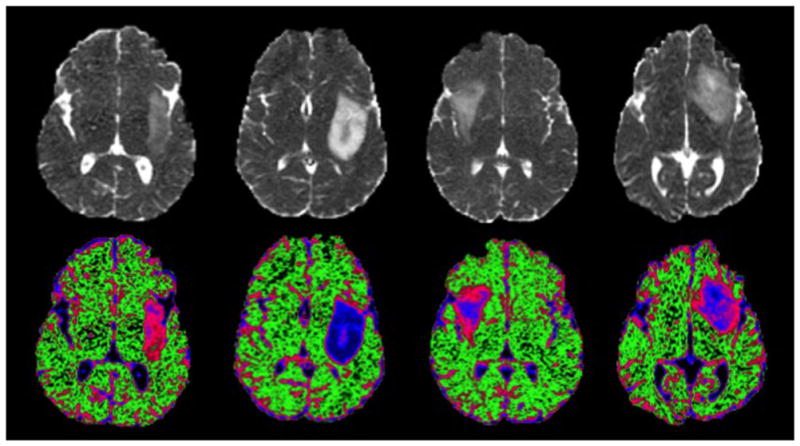
Apparent diffusion coefficient (ADC) images and color-coded maps demonstrating differences in ADC values between patients with oligodendroglioma (far left), astrocytoma (mid-left) and two patients with mixed histology that was classified as oligoastrocytoma (mid-right and far right). The color maps highlight the regions with ADC values that are characteristic of normal brain (green), oligodendroglioma (pink) and astrocytoma (blue). Note the variable spatial patterns of color intensity in the lesions with mixed histology.