
Figure 4.
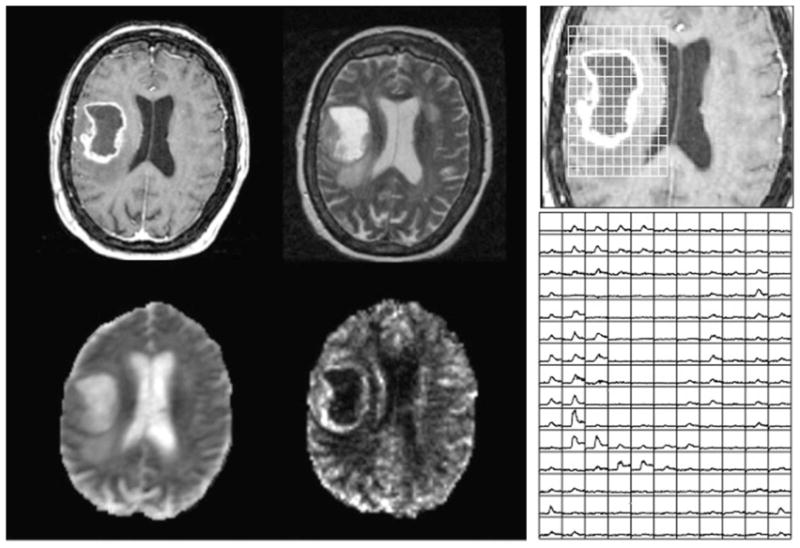
Post-gadolinium T1-weighted (top left), T2-weighted (top right), apparent diffusion coefficient (ADC) (bottom left) and normalized cerebral blood volume (nCBV) (bottom right) images from a patient with an untreated glioblastoma multiforme (GBM). The panel on the right shows the dynamic curves from the dynamic susceptibility-weighted contrast (DSC) data in a region corresponding to the lesion, illustrating the lack of signal in the necrotic core, as well as increased nCBV and reduced recovery in areas of the enhancing rim.