
Figure 9.
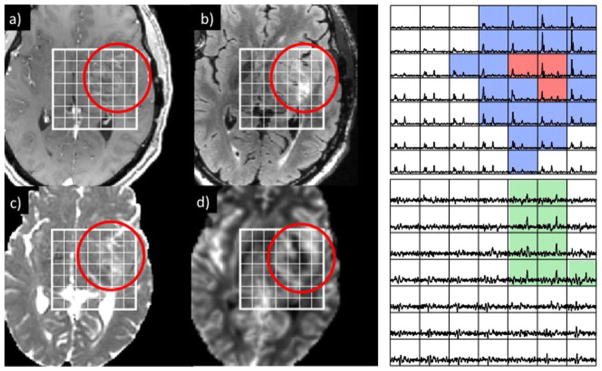
Post-gadolinium T1-weighted (a), fluid-attenuated inversion recovery (FLAIR) (b), apparent diffusion coefficient (ADC) (c) and relative cerebral blood volume (rCBV) (d) images from a region of suspected recurrence in a patient who was originally diagnosed with a grade II astrocytoma. Despite the relatively mild degree of enhancement on the T1 image, there was elevated rCBV in the rim of the lesion, as well as significant regions of abnormal metabolism on the lactate-edited MRSI data. The spectra in the top array show peaks corresponding to elevated choline to N-acetylaspartate (NAA) with no lipid (blue) and both elevated choline to NAA and lipid (red), whereas the bottom array (scaled up by a factor of three) shows peaks corresponding to lactate (green). The patient went for surgery and was diagnosed as having upgraded to a glioblastoma multiforme (GBM).