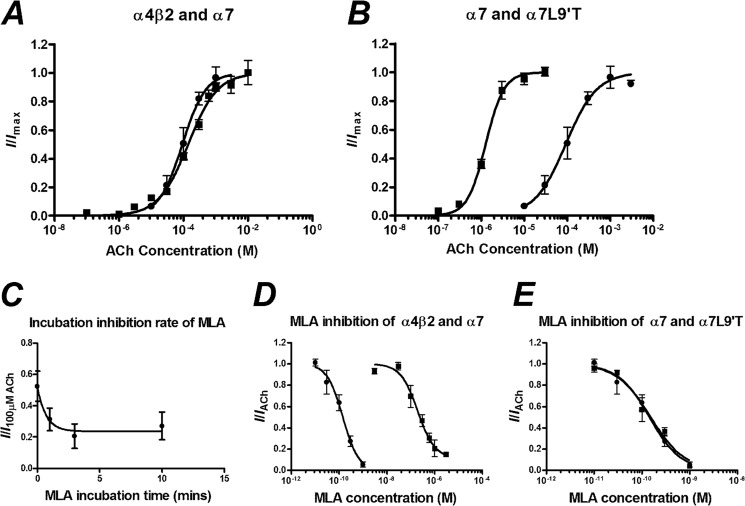
FIGURE 1.
A, concentration-response curves to ACh of oocytes injected with a 1:1 ratio of α4β2 (■) and α7 (●) nAChR mRNA are shown. B, concentration-response curves for ACh against oocytes injected with α7(L9′T) (■) and α7 (●) nAChR mRNA are shown. C, inhibition of 100 μm ACh with 1 μm MLA incubated for various time periods before co-application of 100 μm ACh and 1 μm MLA are shown. D, MLA inhibition concentration-response curves after a 3-min incubation of oocytes injected with a 1:1 ratio of α4β2 (■) and α7 (●) nAChR mRNA are expressed as a fraction of the current elicited by 300 and 100 μm ACh, respectively. E, MLA inhibition concentration-response curves of oocytes injected with α7(L9′T) (■) and α7(●) nAChR mRNA are expressed as a fraction of the current elicited by 1 and 100 μm ACh, respectively. Data are represented as the means ± S.E., and the curve-fitting procedure is as explained under “Experimental Procedures.”

