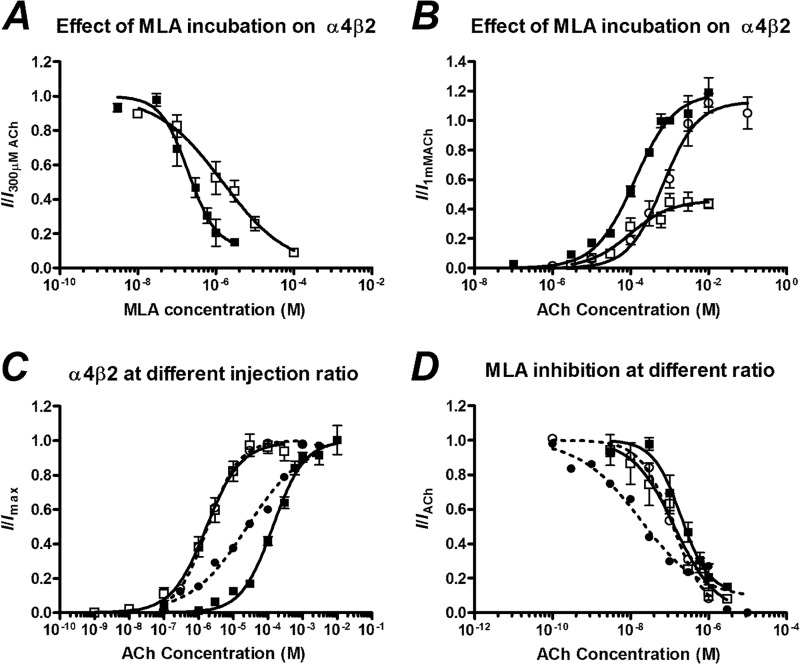
FIGURE 3.
A, MLA inhibition concentration-response curves of oocytes injected with a 1:1 ratio of α4β2 nAChR mRNA after a 3-min incubation (■) and without incubation (□) is expressed as a fraction of the current elicited by 100 μm ACh. B, shown are concentration-response curves to ACh of oocytes injected with a 1:1 ratio of α4β2 nAChR mRNA in the absence of MLA (■), in the presence of 200 nm MLA after a 3-min incubation (□), and in the presence of 2 μm MLA without incubation (○). C, shown are concentration-response curves of ACh of oocytes injected with α4β2 mRNA in a 1:1 (■) and 1:10 (□) ratio (solid lines) and α4(D204C)β2 mRNA in a 1:1 (●) and 1:10 (○) ratio (dashed lines). Currents are normalized to the maximum current of each individual cell. D, shown are MLA inhibition concentration-response curves of oocytes injected with α4β2 mRNA in a 1:1 (■) and 1:10 (□) ratio (solid lines) and α4(D204C)β2 mRNA in a 1:1 (●) and 1:10 (○) ratio (dashed lines). Currents are normalized to the current elicited by 300 μm ACh (1:1), 1 μm (1:10), 30 μm ACh (D204C 1:1), or 1 μm (D204C 1:10). Data are represented as the means ± S.E., and the curve-fitting procedure is as explained in the data analysis under “Experimental Procedures.”

