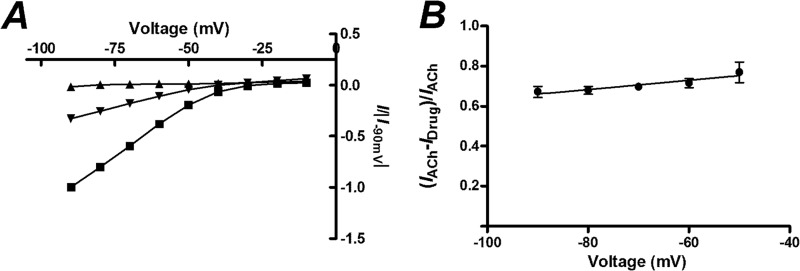
FIGURE 4.
Current-voltage (I-V) relationship of oocytes injected with a 1:1 ratio of α4β2 nAChR mRNA in the absence of MLA or after a 3 min incubation with MLA. A, the currents normalized to the response to 100 μm ACh at −90 mV are shown for different voltages when 100 μm ACh (■), 300 nm MLA (▴), or 300 nm MLA and 100 μm ACh (▾) is applied. B, the fraction of the ACh response that is inhibited by 300 nm MLA at different holding potentials is shown. Slope = 0.0023 ± 0.001, p = 0.19 cf. 0, z-test, n = 4). Data points are given as the means ± S.E.

