
FIGURE 8.
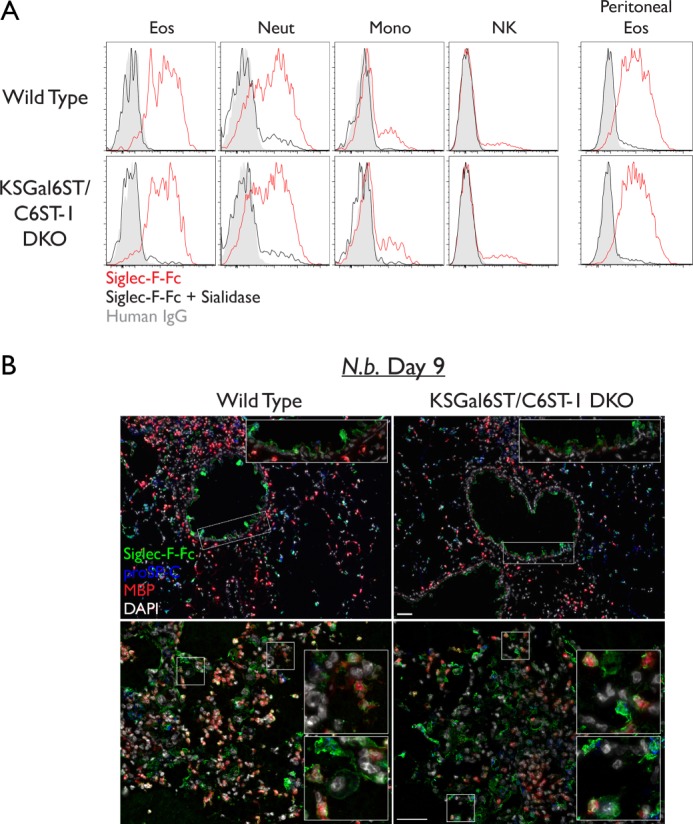
Siglec-F ligand expression in leukocytes from KSGal6ST/C6ST-1 DKO mice. A, flow cytometry analysis of leukocyte subsets stained with Siglec-F-Fc (red histograms). Staining after sialidase treatment (black histograms) and staining with human IgG (gray histograms) are shown. Scale bars represent 50 μm. Results are representative of two independent experiments. B, cryostat-cut sections of lungs from N. brasiliensis-infected mice. Sections were stained with Siglec-F-Fc (green), anti-eMBP (red), anti-proSP-C (blue), and DAPI (white). Low power (top) and high power (bottom) fields are shown. Eos, eosinophils; Neut, neutrophils; Mono, classical monocytes; NK, natural killer cells.