
FIGURE 3.
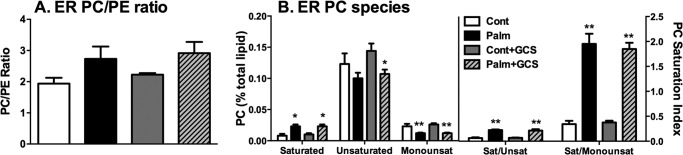
MIN6 cell ER PC species and saturation. A, MIN6 cells were pretransfected ± the GCS construct and then treated chronically (48 h) with 0.4 mm palmitate (Palm)/0.92% BSA and fractionated. Then, peak ER fractions were quantified via mass spectrometry. The ER PC/PE ratio represents the ratio of mean PC to PE lipid (percent of total lipid content) + S.E. from three independent experiments. B, saturated (Sat), unsaturated (Unsat) (≥ 1 double bond), and monounsaturated (Monounsat) (= 1 double bond) ER PC species (left panel) and those species represented as ratios (right panel). Data represents mean lipid (percent of total lipid content) + S.E. from three independent experiments. *, p < 0.05; **, p < 0.01; unpaired Student's t test compared with control. Con, control.