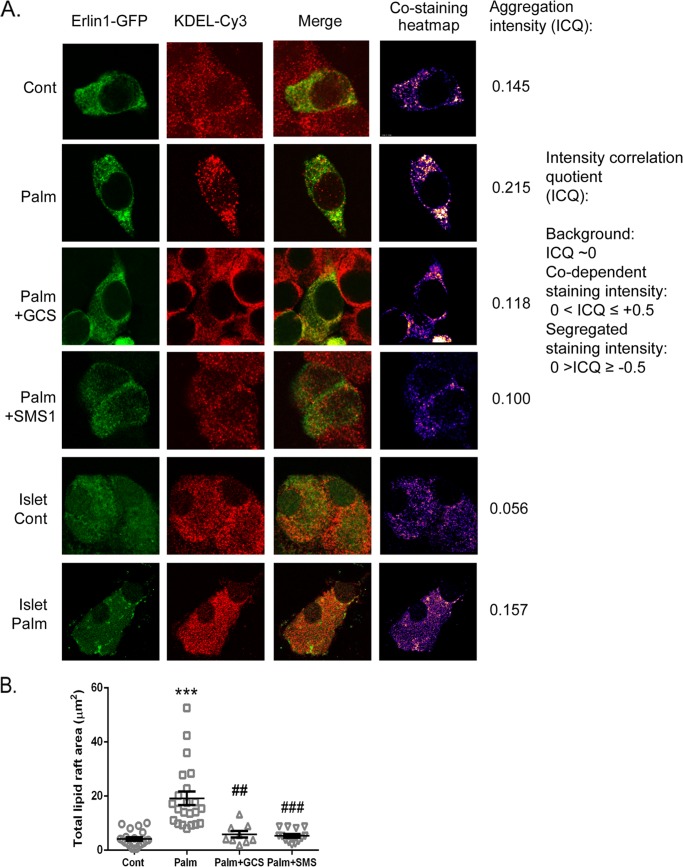
FIGURE 5.
Palmitate-induced alterations in ER sphingomyelin and cholesterol are implicated in the disruption of ER lipid raft distribution. A, MIN6 cells or primary islet cell monolayers were transfected with the ER raft marker Erlin1-GFP (green) prior to 0.4 mm palmitate (Palm)/0.92% BSA treatment (48 h). Fixed cells were stained with anti-KDEL antibody (a marker of the ER-resident proteins Grp94 and Bip) and Cy3 secondary (red) to verify ER localization of Erlin-1. The visual representation of the intensity of positive red and green costaining areas was generated on a costaining heatmap by intensity correlation analysis plugin (16) (Image J), plotting areas of low-to-high (blue-to-white) intensity. Scale bar = 10 μm. B, total mean lipid raft area ± S.E. (μm2) of MIN6 Erlin-GFP images. ***, p < 0.001 versus control; ##, p < 0.01; ###, p < 0.001 versus palmitate; Kruskal-Wallis test with Dunn's multiple comparisons. Images are representative of mean ICQ and raft area values from three to six independent experiments (Cont, Palm, +GCS, and +SMS conditions).

