
FIGURE 3.
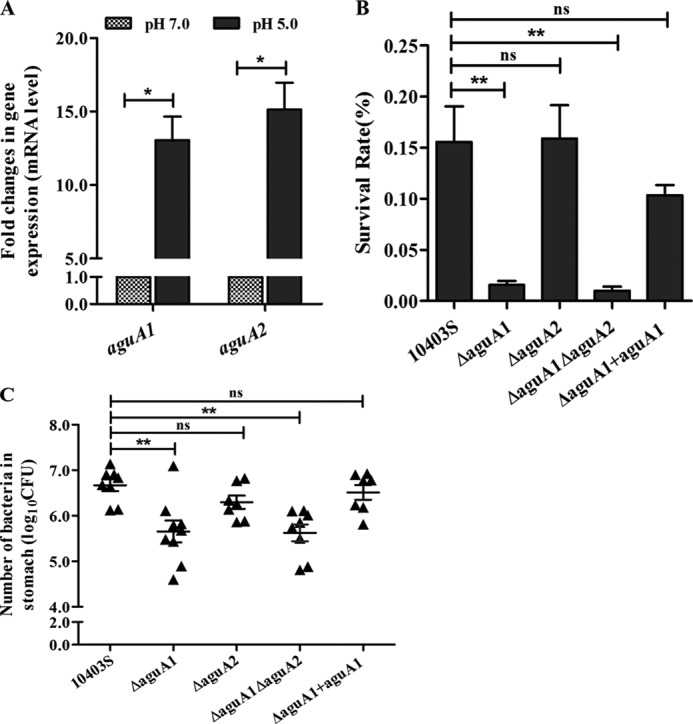
Responses or roles of aguA1 and aguA2 under acidic stresses. A, relative quantification of aguA1 and aguA2 mRNA levels in L. monocytogenes 10403S exposed to BHI medium at pH 5.0 and 7.0. Values are expressed as means ± S.D. B, survival of L. monocytogenes 10403S, its mutant, and complement strains in synthetic human gastric fluid at pH 2.5. Values are expressed as means ± S.D. C, survival of L. monocytogenes 10403S, its mutant, and complement strains in the stomach of mice receiving intragastric inoculation. Values are expressed as means ±S.E. *, p < 0.05; **, p < 0.01; ns, p > 0.05.