
FIGURE 2.
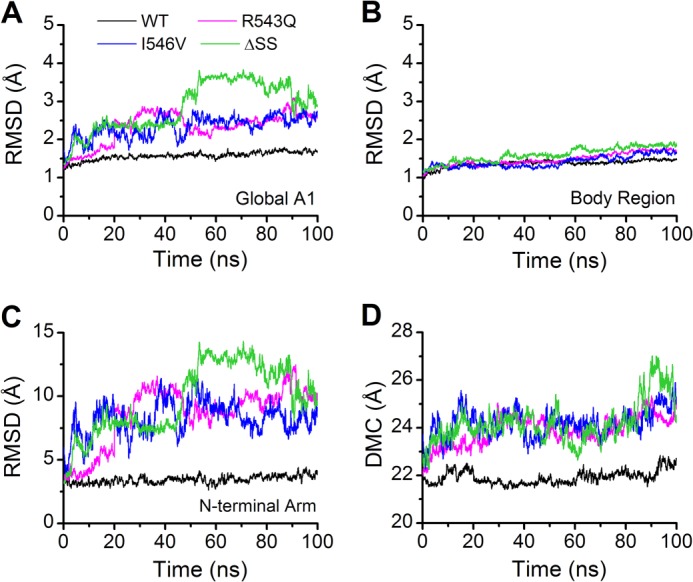
The mean time curves of RMSD and DMC for WT A1 (black) and its three mutants (R543Q, magenta; I546V, blue; ΔSS, green). RMSD stands for the Cα root mean square deviation, and DMC expresses the distance between the mass centers of the N-terminal arm and the A1 body region. Each of the time-RMSD profiles, which are shown with a moving average over 20 ps, for the global A1 (residues 498–700) (A) and the body region (residues 509–695) (B) as well as the N-terminal arm (residues 498–508) (C), presents an average of data from three independent runs and so do the time-DMC profiles (D). The time-RMSD profiles of the global WT A1 (A) and the N-terminal arm (C) are smoother and remain at a lower level in comparison with R543Q, I546V, and ΔSS, and so do the time curves of DMC (D), suggesting that the structural stability lies in the wild-type A1 but not in the mutants.