
FIGURE 4.
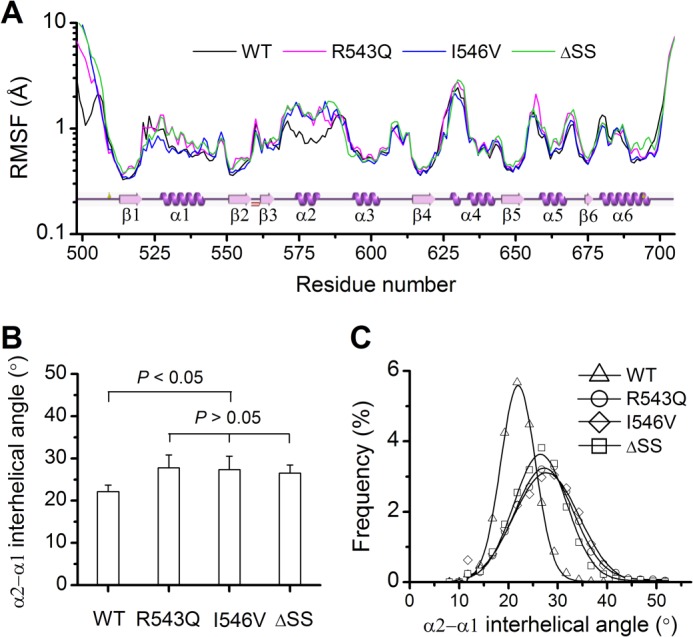
Dynamic properties of the WT A1 domain and its three GOF mutants. A, the distribution of RMSF (WT A1, black; R543Q, magenta; I546V, blue; ΔSS, green) on the residue chain of A1. Plot of the secondary structure versus the residue chain came from the website PDBsum, and the data shown were averaged over all three runs. B, the α2-α1 interhelical angle (θ) averaged over the entire simulation duration of 100 ns for each the three runs. The data shown are means ± S.E. The p values of the unpaired two-tailed Student's t test are shown to indicate the statistical difference significance, or lack thereof. C, distribution of the α2-α1 interhelical angle θ. The frequency (WT A1, ▵; R543Q, ○; I546V, ♢; ΔSS, □) is the ratio of the number of the clustered conformations with the α2-α1 interhelical angle variation of 0.25 degree above and below a given θ value to the sum of all conformations simulated within duration of 100 ns. The data of the frequency were fitted to the Gaussian distribution (solid black line) with the values given as the means ± S.D. such 21.96 ± 3.51 for WT, 27.23 ± 5.95 for R543Q, 27.69 ± 6.68 for I546V, and 26.47 ± 5.38 for ΔSS. All data are means of those in three runs.