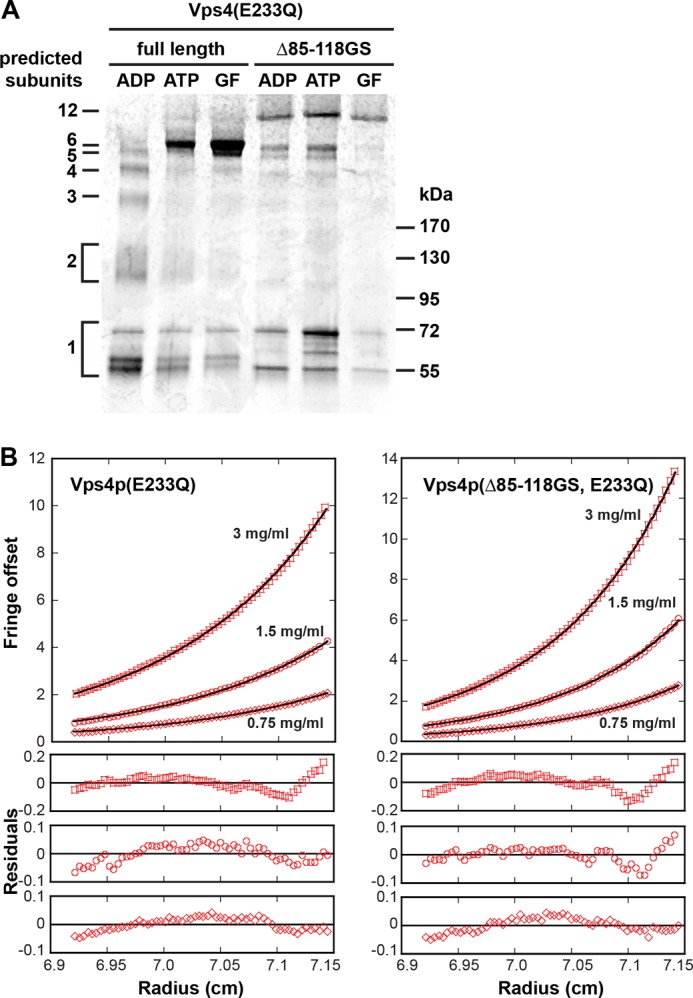
FIGURE 5.

Analysis of the quaternary structure of Vps4. A, recombinant Vps4 protein was cross-linked by glutaraldehyde in the presence of ADP or ATP, and the products were analyzed by SDS-PAGE (4–15% gradient gel) followed by Coomassie Blue staining. The GF lanes contain the cross-linking products of the Vps4 peak fractions from the gel filtration analyses shown in Fig. 4A. B, analytical ultracentrifugation of Vps4(Δ85–118GS, E233Q) and Vps4(E233Q) in the presence of ATP. The interference signal from scans taken at equilibrium at 5000 rpm is plotted versus the distance from the axis of rotation (radius) as red, with open symbols representing different protein concentrations (squares, 3 mg/ml; circles, 1.5 mg/ml; diamonds, 0.75 mg/ml). The black solid line represents a global fit over all concentrations and including data taken at 3000 rpm (not shown). Residuals are shown below for all concentrations.
