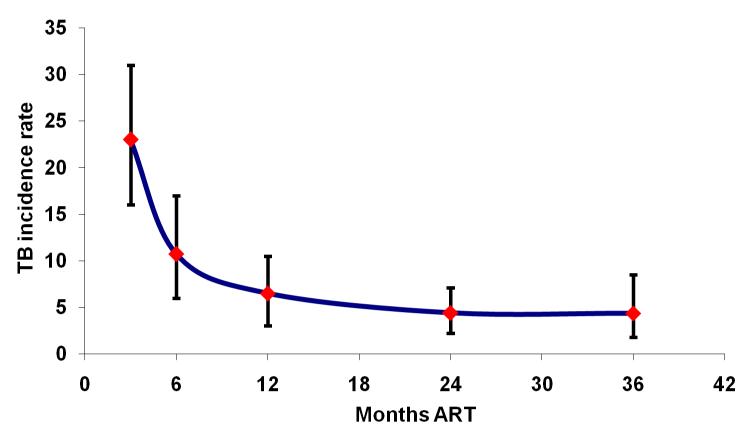
Figure 5.
Graph showing changing tuberculosis (TB) incidence rate (95% confidence intervals, cases per 100 person-years) with increasing duration of antiretroviral therapy (ART) in a South African cohort. The incidence rate is extremely high in the first 3 months but rapidly decreases thereafter. Data adapted from [23, 12].

