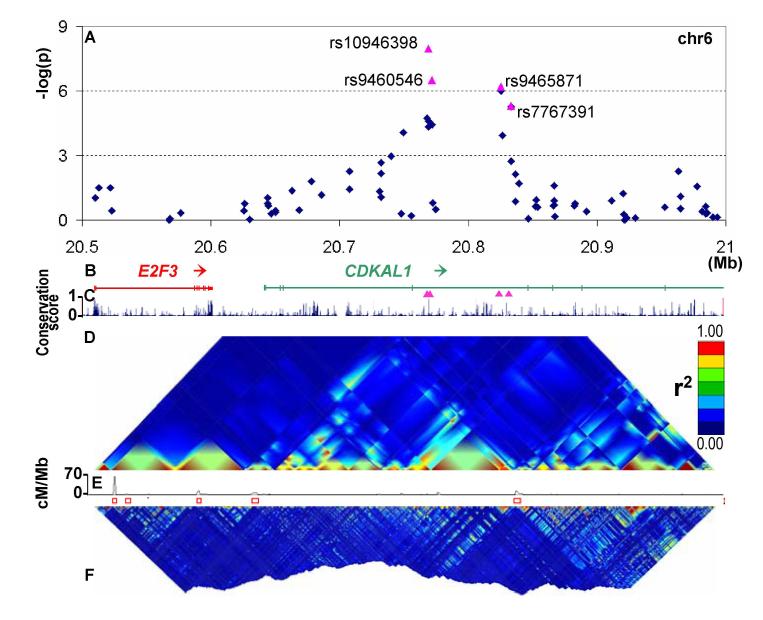
Figure 1. Overview of CDKAL1 signal region.
A Plot of −log(p values) for T2D (Cochran-Armitage test for trend) against chromosome position in Mb. Blue diamonds represent primary scan results and pink triangles denote meta-analysis results across all UK samples.
B Genomic location of genes showing intron and exon structure (NCBI Build 35). Pink triangles show position of replication SNPs relative to gene structure.
C MULTIZ (24) vertebrate alignment of 17 species showing evolutionary conservation.
D GoldSurfer2 (25) plot of linkage disequilibrium (r2) for SNPs genotyped in WTCCC scan (passing T2D-specific quality control) in WTCCC T2D cases.
E Recombination rate given as cM/MB. Red boxes represent recombination hotspots (26).
F GoldSurfer2 plot of linkage disequilibrium (r2) for all HapMap SNPs across the region (HapMap CEU data).

