
Figure 2.
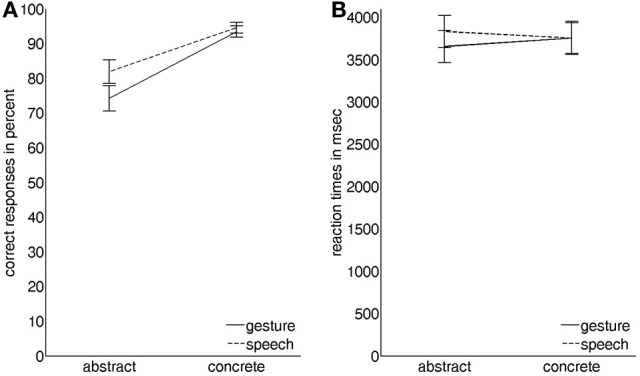
Graphical illustration of the interaction effects of the two factors modality (gesture vs. speech) and abstractness (abstract vs. concrete) on (A) the number of correct responses in percent and on (B) the corresponding reaction times in ms (vertical lines indicate standard errors of the mean).