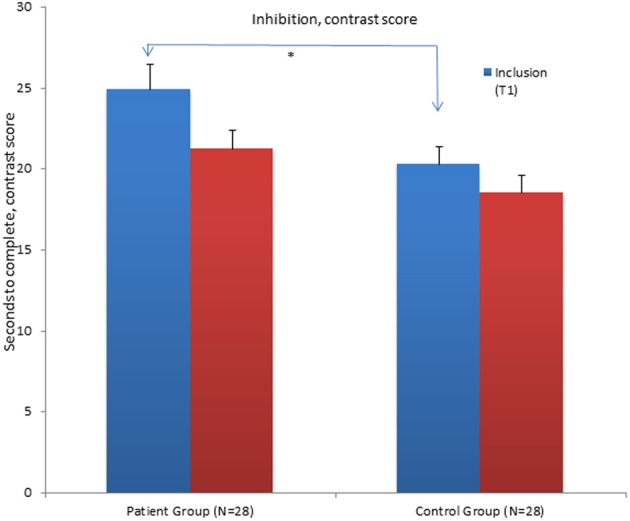
Figure 1.

Mean contrast scores for the Inhibition condition of the Color Word Interference Test (CWIT) for the patient group and control group at inclusion (T1) and at follow-up assessment (T2). *Significant differences between the groups. Graphs represent mean Standard Error (SE).
