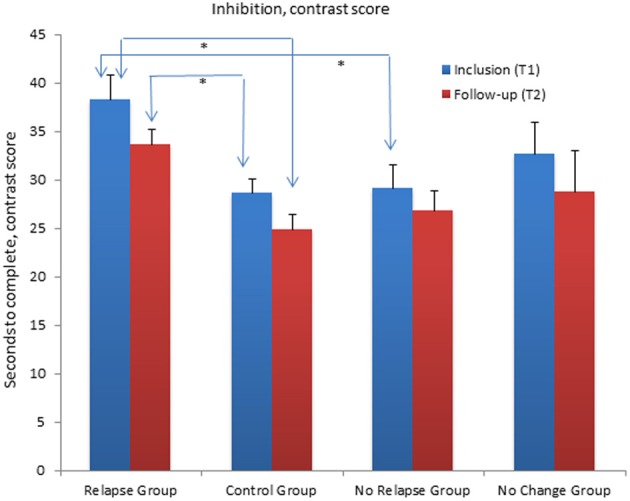
Figure 4.

Mean contrast scores for the Inhibition/switching condition of the Color Word Interference Test (CWIT) for the relapse group, the no relapse group, the no change group and the control group at inclusion (T1) and at follow-up assessment (T2). The Relapse Group performed significantly poorer compared (p < 0.01) to the No Relapse Group and the Control Group at T1. At T2 the Relapse group performed significantly poorer than the Control Group (p < 0.01). Graphs represent mean Standard Error (SE).
