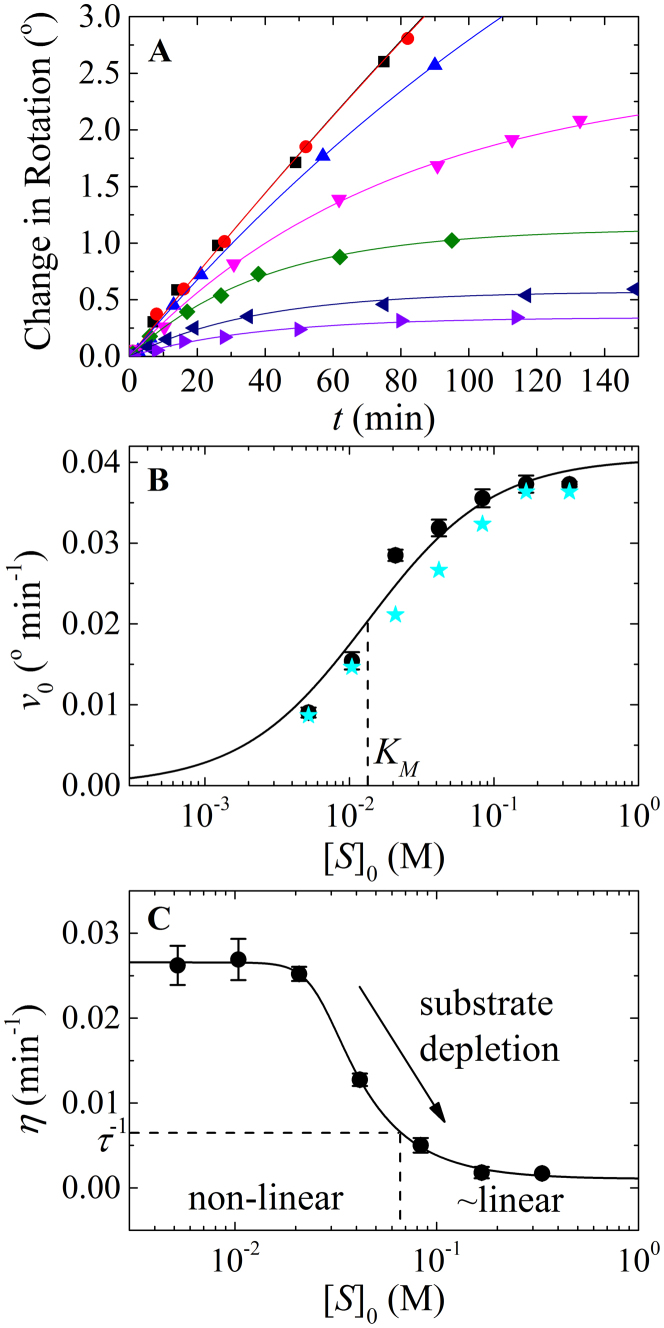
Figure 1. Analysis of Michaelis' and Menten's experimental data.
(A). Time courses of product formation from Michaelis' and Menten's experiment 1 at [S]0 of 0.333 ( black), 0.167 (
 red), 0.0833 (
 blue), 0.0416 (
 magenta), 0.0208 (
 olive), 0.0104 (
 navy) and 0.0052 M (
 violet). The solid lines through the data points represent the best-fits to the product inhibition/substrate depletion equation (Eq. 1). Data at times longer than 150 min were also included in the fit but are not shown for clarity. (B). [S]0-dependence of the initial enzyme cycling velocity (filled black circles) with the standard error (black bars) obtained from the best-fits shown in Figure 1A. The initial velocities (filled cyan stars) obtained by Michaelis and Menten from fitting data points acquired at an early time regime to a straight line are also plotted for comparison. To convert the observed optical rotation change to product concentration, we used the following relation derived from the conversion used by Michaelis and Menten: change in optical rotation = 1.313 m° = 55.62° M−1 m° = 42.36° M−1 is the optical rotation of one molar sucrose substrate, obtained by linear fit of the optical rotation vs. initial sucrose substrate concentration (t = 0) according to Table 1 in Michaelis' and Menten's original paper6,11. The solid line represents the best-fit to a rectangular hyperbola (Eq. A9), yielding values for Vm (i.e. kcat[E]tot) = 0.73 (±0.03) mM min−1, KM = 13 (±3) mM and Vm/KM = 0.055 (±0.0006) min−1, similar to the Vm = 0.76 (±0.05) mM min−1, KM = 16.7 mM and Vm/KM = 0.0454 (±0.0032) min−1 reported by Michaelis and Menten6,11. Uncertainty bars in Panels B and C represent the standard errors from the corresponding fits. (C). [S]0-dependent enzyme cycling velocity reduction rate constant η. The solid line through the data points is for visualization only. Substrate concentration regimes where time courses will display linear and non-linear behavior are indicated.

