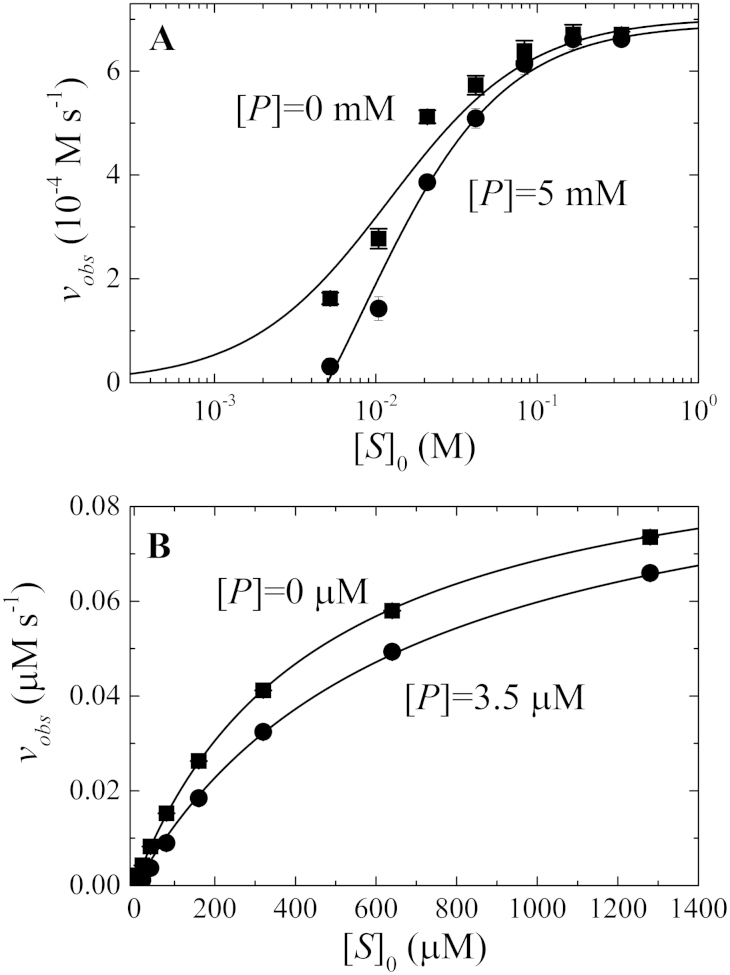
Figure 3. Analysis of product binding and inhibition.
[S]0-dependence of enzyme cycling velocity calculated according to Eq. 2 at product concentrations of: panel A. 0 and 5 mM for Michaelis and Menten's data from Figure 1A; and panel B. 0 and 3.5 μM for the simulated time courses presented in Figure 2A. The smooth lines through the data points represent the best fits to the mixed inhibition equation (Eq. 3).

