
Fig. 2.
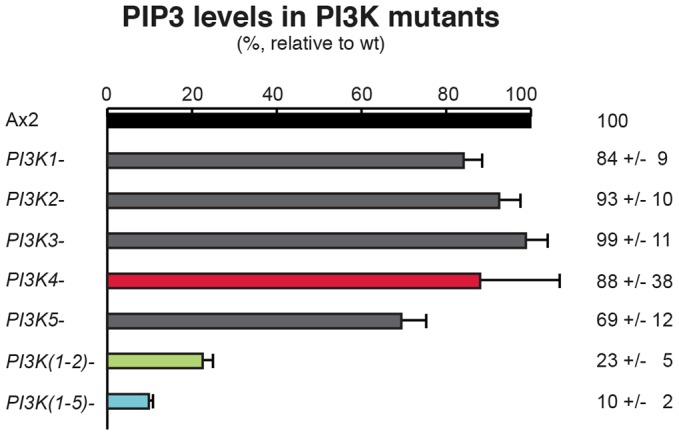
PtdIns(3,4,5)P3 (PIP3) levels in PI3-kinase mutants. PtdIns(3,4,5)P3 levels (%; mean ± s.e.m.) in PI3-kinase mutants relative to wild-type (Ax2) cells were measured by mass spectroscopy. Data are the means of three to five biological experiments, with triplicate samples taken in each and analysed in multiple spectra.