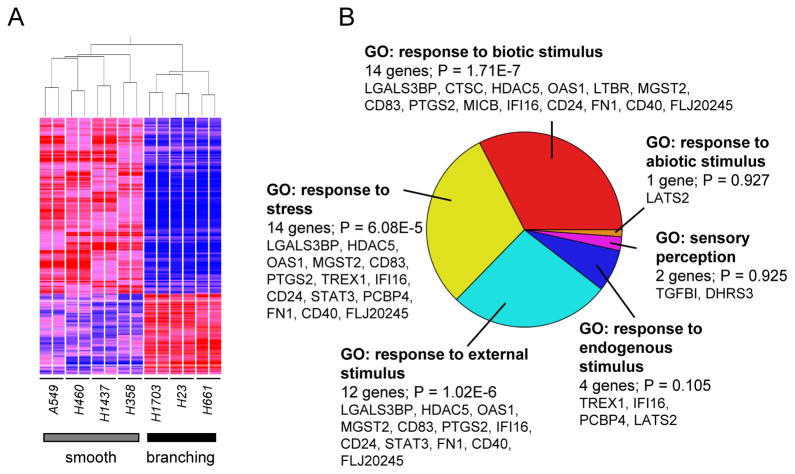
Figure 3. Analysis of transcripts differentially expressed in lung cancer cell lines that grow as smooth or invasive morphologies.
A. Hierarchical clustering of 200 transcripts that are significantly different (p<1e-5, ANOVA) between lung cancer cell lines that grow as smooth or invasive morphology in 3D culture. Red, elevated transcript expression; blue, decreased expression. B. Gene Ontology (GO) analysis of genes distinguishing smooth and invasive morphology as subset of GO:8150: biological_process.

