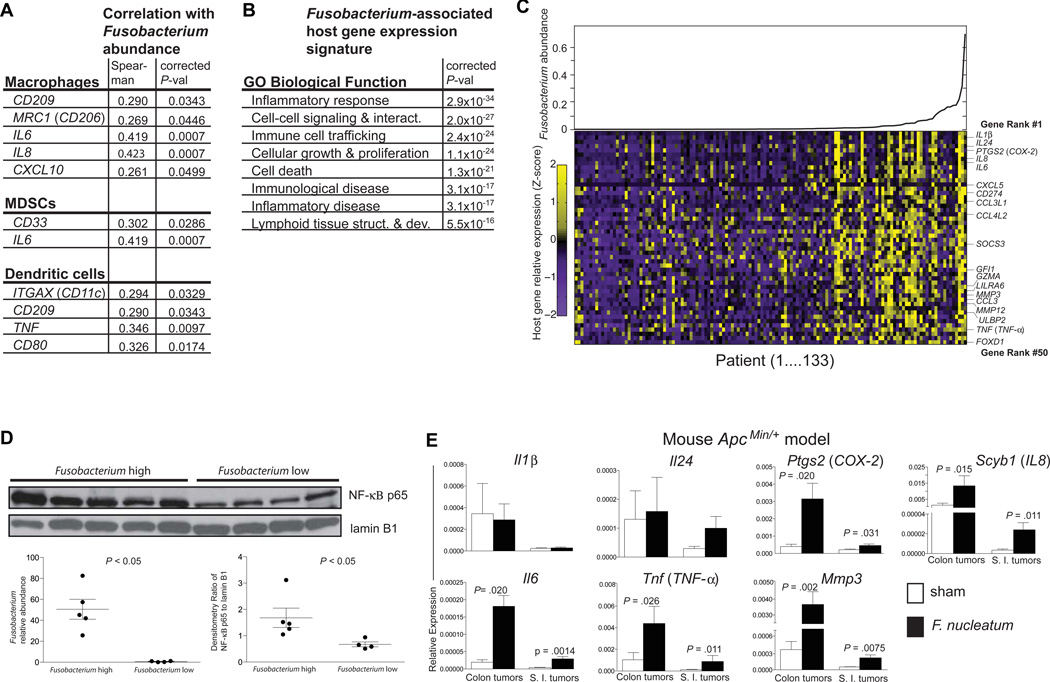
Figure 4. A Fusobacterium-associated human colorectal cancer gene signature shared and validated in mice.
(A) Immune cell types enriched in Fusobacterium-associated mouse tumors are shown with the human marker gene utilized to determine abundance in the TCGA CRC RNA-seq data set. (B) Ingenuity Pathway Analysis Biological Function Gene Ontology categories enriched for Fusobacterium abundance-correlating gene sets are shown. (C) Fusobacterium spp. transcript relative abundance are plotted for the 133 TCGA colon tumors (upper panel and lower panel x-axis) and scaled expression values for the top 50 ranked genes denoted as the row Z-score (y-axis) are shown in a heat map (lower panel) with a purple (low expression)–yellow (high expression) color scale. (D) Western blot of nuclear extracts from human colon cancer with a high or low Fusobacterium relative abundance. Fusobacterium relative abundance and western blot densitometry are shown in the lower panel. (E) qPCR analysis of a selection of the top 50 ranked genes in (B) in colon and small intestinal tumors from F. nucleatum vs TSB fed ApcMin/+ mice. Data are represented as mean +/− SEM. Tumors from 6–9 mice per group were used. See also Fig. S3.

