
Figure 5.
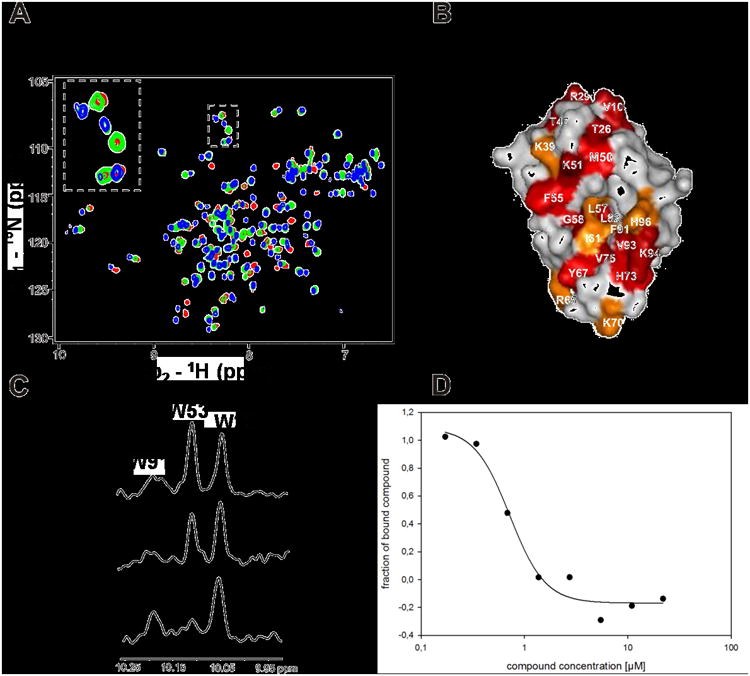
Screening activities of PB12. A. HSQC1H-15N HSQC spectra of Hdm2 (1-125) titrated with increasing amount of PB12. Red spectrum is a reference of apo-Hdm2, green spectrum corresponds to approximately 40% saturation of Hdm2 with PB12; the spectrum shows slow chemical exchange that is typical for strong interactions with submicromolar Kds. Blue spectrum corresponds to Hdm2 fully saturated with PB12. B: perturbation plot of PB12; C: AIDA-NMR experiment: the concentration of the p53 released from the Hdm2/p53 complex by the antagonist is proportional to the height of the HN indole peak of W23(p53). The bottom spectrum shows the downfield shifted NMR signals of 20 μM Hdm2/p53 complex, the middle one shows approximately 70% of dissociation of the complex upon addition of PB12 to the complex in 1:1 molar ratio, the upper spectrum shows signals of the free p53.; D: study of the PB12 by the fluorescent polarization assay.[11,25]