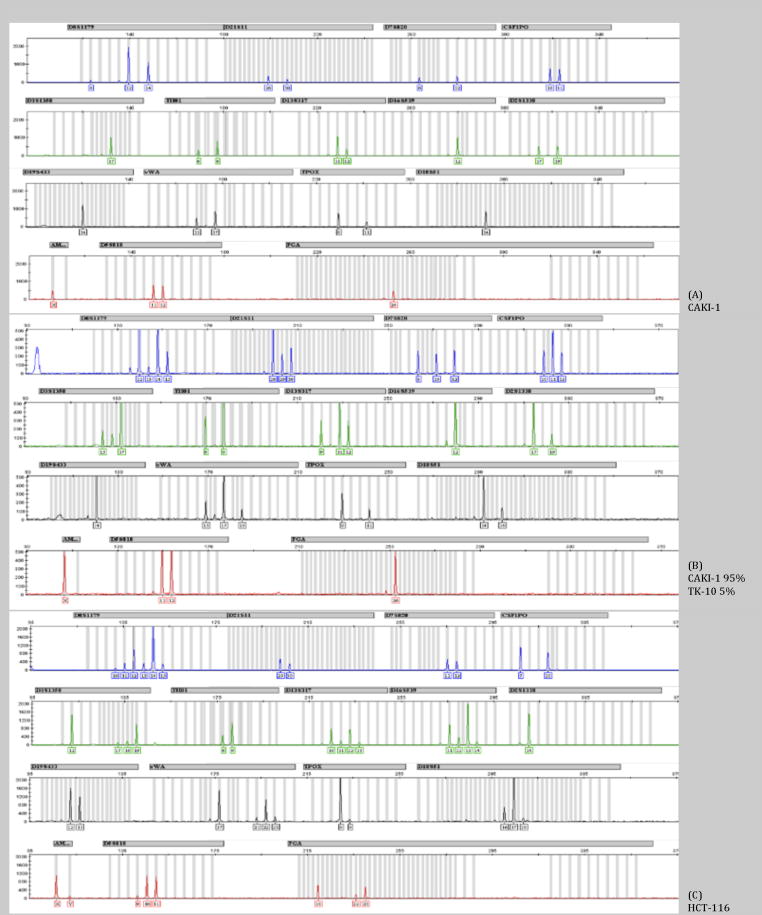
Figure 1. STR profiles for representative cell lines.
Shown are the STR profiles generated using the GeneMapper (Applied Biosystems) software using the AmpFℓSTR Identifiler kit. The Y-axis shows relative peak heights for the PCR products that are generated. On the X-axis the PCR length are shown. The grey columns indicate the length of the known PCR products within a locus. (A) STR profile for CAKI-1. (B) STR profile for a mixture of two cell lines, CAKI1 at 95% and TK-10 at 5%. (C) STR profile for HCT-116.

