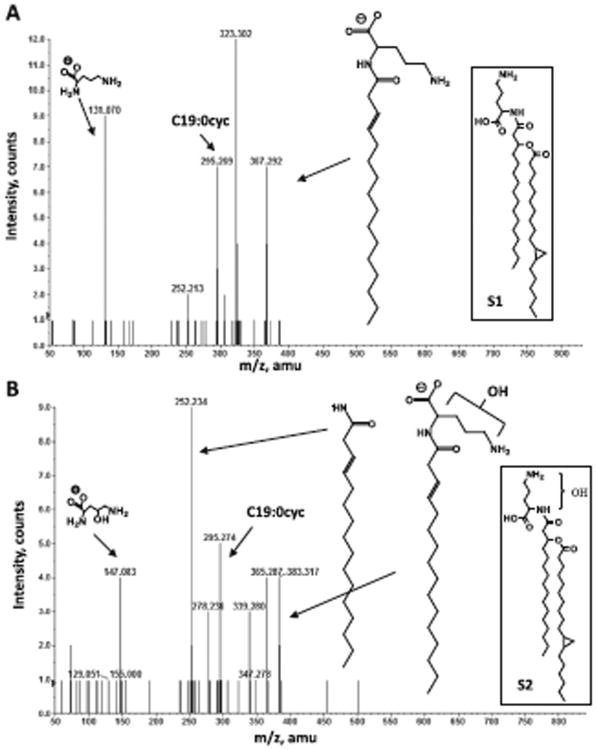
Fig. 2.
Collision-induced dissociation mass spectra of OL S1 and S2 detected in lipid extract of A. tumefaciens. Negative ion collision induced dissociation mass spectra of [M-H]− ions at m/z 663.6 (A) obtained from OL S1 and m/z 679.6 (B) obtained from OL S2. The structures of major fragment ions are indicated. The structures of the parental lipids are shown in the boxes.

