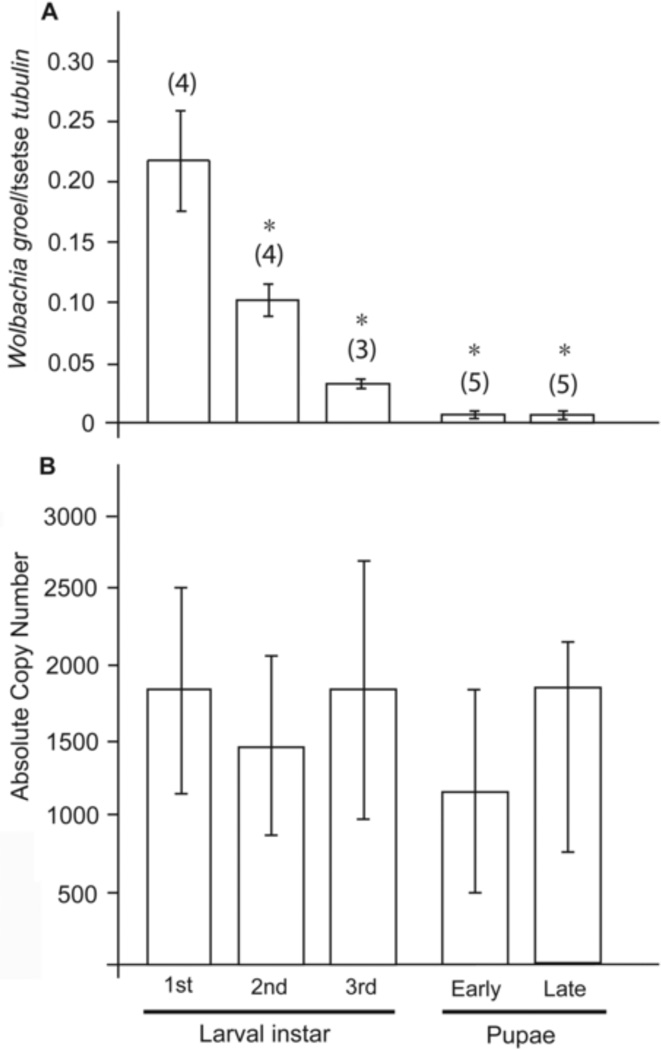
Fig. 3. Wolbachia density through juvenile development.
(A) Wolbachia density normalized to host β-tubulin levels, (B) absolute copy number of Wolbachia present in the different developmental stages analyzed. Error bars represent the standard error of the mean. Numbers in parentheses represent the sample size (n). Asterisks above bars represent statistically significant data according to Tukey-Kramer post-hoc comparisons (P<0.05).

