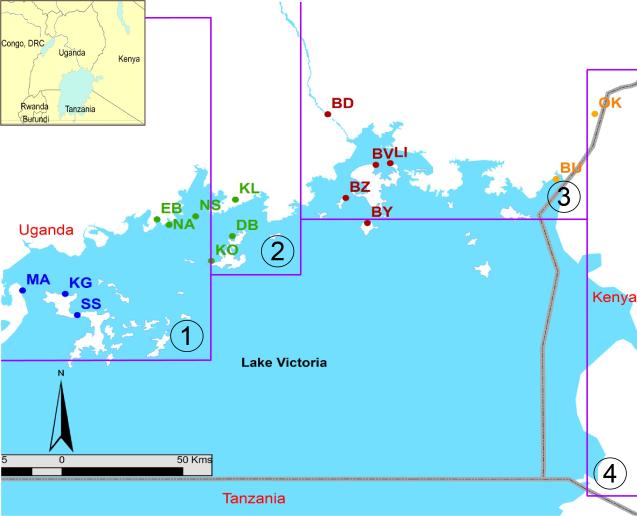
Figure 4. Genetic differentiation of Gff around Lake Victoria.
Sixteen Gff populations were studied by microsatellite analysis from coastal mainland and island sampling sites. The purple lines identify the 4 PATTEC blocks. The map shows the locations of each sampling site (dots) and the genetic assignment (dot color) of each sampling site based on the Bayesian clustering program Structure: orange = cluster 1; brown = cluster 2; green= cluster 3, and blue = cluster 4. This figure shows that the operational blocks do not coincide with the genetic boundaries of the vector. Figure modified from [42].

