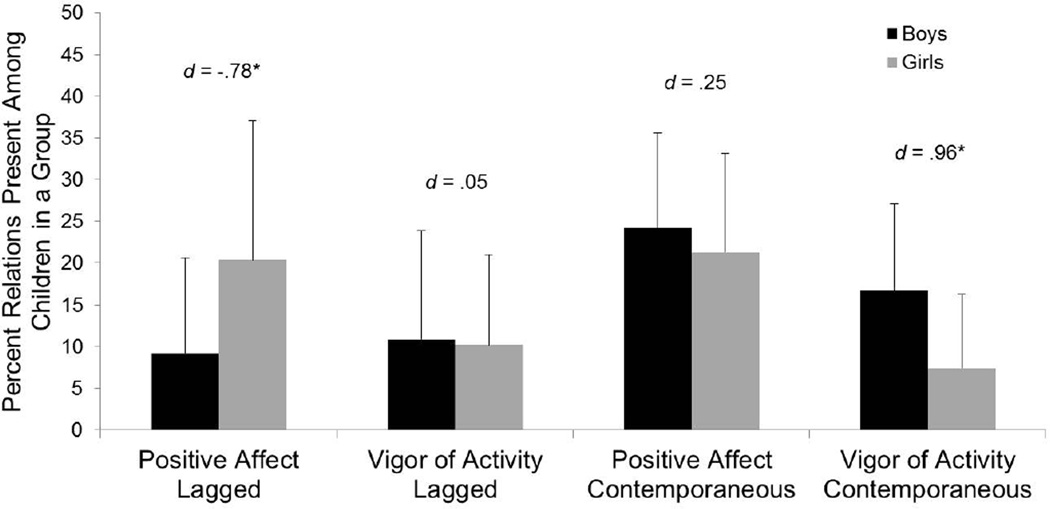
Figure 2.
Sex differences in percent of lagged positive affect, lagged vigor of activity, contemporaneous positive affect, and contemporaneous vigor of activity relations among children in a play group in final uSEM models (N = 19). Error bars depict standard deviations; d’s indicate the effect sizes of the sex differences (Cohen, 1988).
*p < .05, one-tailed.

