
Figure 2(A-F).
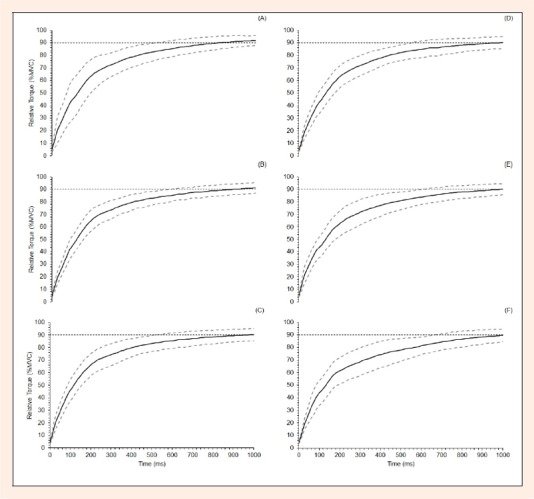
Normalized moment-time curve, averaged for all subjects from the first (A) to sixth (F) week of training. For each subject, data obtained in all repetitions performed during the first weekly training session were collapsed. Dashed horizontal line corresponds to 90% of maximal voluntary contraction (MVC). Data are expressed as mean (solid line) ± SD (dashed line).