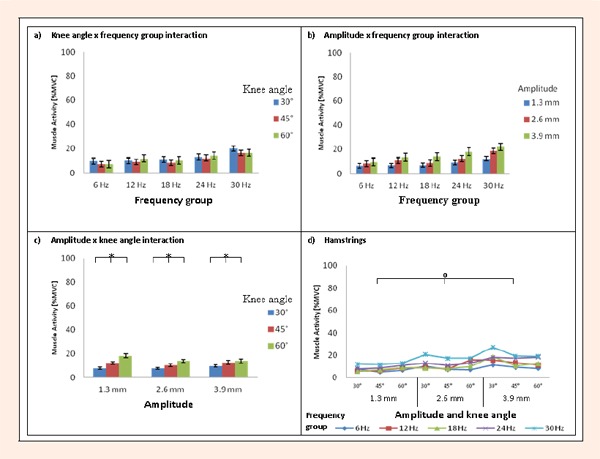
Figure 2.

Mean ± SE EMG% MVC values of the hamstrings for ‘knee angle x frequency group’ interaction effect (a), ‘amplitude x frequency group’ interaction effect (b), ‘amplitude x knee angle’ interaction effect (c) and mean EMG% MVC values regarding all biomechanical variables (d). * Significant differences in muscle activity (p < 0.05). O Significant differences in main effect of ‘amplitude (p < 0.05).
