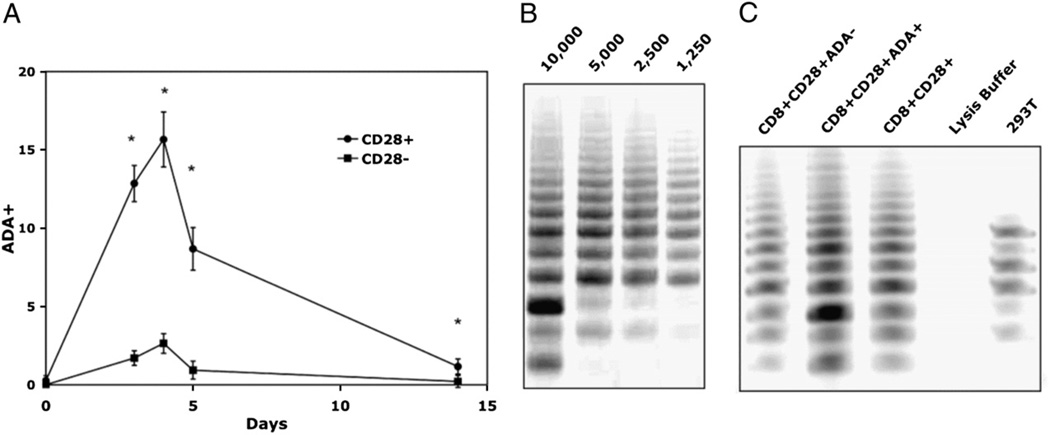
FIGURE 1.
Higher telomerase activity in CD8+CD28+ T cells that express ADA. A, Kinetics of ADA cell surface expression following stimulation with Ab-coated microbeads. Gated populations of CD3+CD8+CD28+ versus CD3+CD8+CD28− T lymphocytes were evaluated from four individual cultures. B, Representative gel showing that four different cell equivalents of CD8+ T cells (10,000, 5,000, 2,500, 1,250 cell equivalents) fall in the linear range of telomerase activity. Cultures were stimulated with irradiated allogeneic B lymphoblastoid cells, and, on day 4, cell lysates were prepared, and telomerase activity was analyzed using the modified TRAP assay as described in Materials and Methods. C, TRAP assay gel from a representative culture after separation of CD8+CD28+ subset into ADA+ and ADA− using 2500 cell equivalents per lane.

