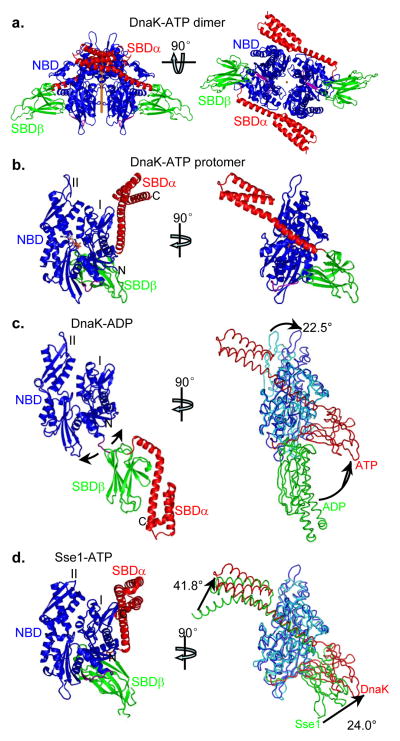
Figure 2. Overall structure of ATP-bound DnaK (DnaK-ATP).
Domain coloring in the ribbon diagrams is as in Fig. 1a throughout.
a, Ribbon diagrams of the DnaK dimer. Left: View with dyad axis (orange rod) vertical. Domains are labeled for protomer A; protomer B is on the right. Right: Orthogonal view from below, along the dyad axis (orange dot).
b, Ribbon diagram of a DnaK protomer in the canonical, front-face NBD view (left) and in an orthogonal side view (right). The NBD lobes are labeled as I and II. The bound ATP molecule is in stick representation.
c, Comparison with a DnaK-ADP structure. Left: ribbon diagram of the DnaK-ADP structure in the front-face NBD view (PDB 2KHO). Right: Side view of DnaK-ATP as in Fig. 2b right panel, but in backbone worm representation and superimposed onto DnaK-ADP based on NBD Lobe-I Cαs. Domain coloring is NBD from DnaK-ATP (blue), SBD from DnaK-ATP (red), NBD from DnaK-ADP (cyan) and SBD from DnaK-ADP (green).
d, Comparison with the Sse1-ATP structure. Left: ribbon diagram of the Sse1-ATP structure in the front-face NBD view (PDB 2QXL). Right: Side view of DnaK-ATP as in Fig. 2b right panel, but in backbone worm representation and superimposed onto Sse1-ATP based on NBD Lobe-I Cαs. Domain coloring is NBD from DnaK-ATP (blue), SBD from DnaK-ATP (red), NBD from Sse1-ATP (cyan) and SBD from Sse1-ATP (green).

