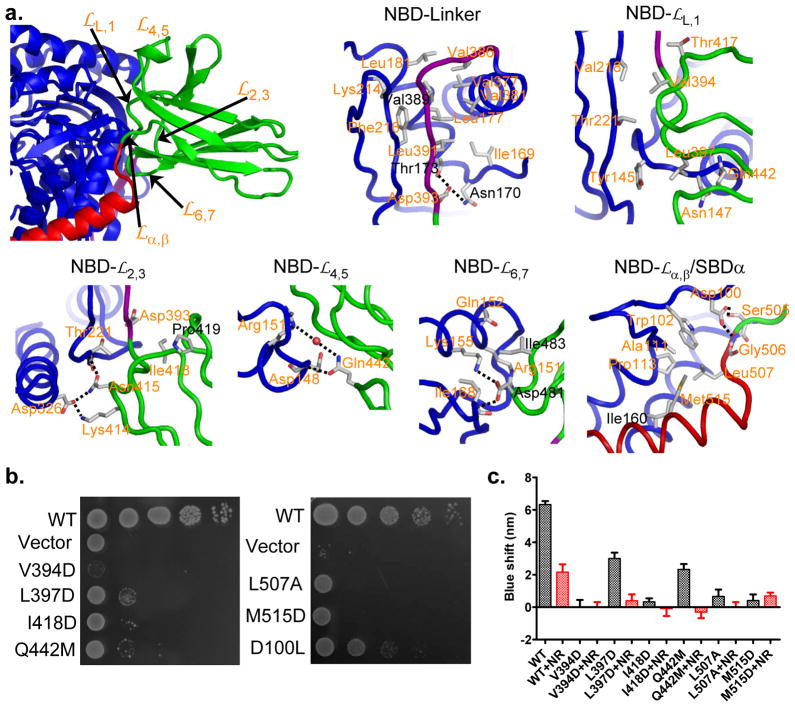
Figure 6. Characteristics of domain interfaces in DnaK-ATP.
a, Identification of NBD-contacting loops from SBDβ (upper left; domain coloring as in Fig. 1a), and associated details of the individual contacts as labeled. Residues targeted for mutagenesis are featured in the details. Residues that were tested in the Sse1-ATP structure paper are labeled in black.
b, Growth tests on interfacial mutant variants. Serial dilutions of fresh cultures, transformed with the respective mutant genes, were spotted onto plates and grown at 37°C.
c, ATP-induced tryptophan-fluorescence shifts. Shifts in the maximum of Trp102 fluorescence are shown in the absence of peptide substrates (black bars) and after addition of 30μM substrate peptide NR (red bars). For each protein, the blue shift was averaged from five independent measurements from at least two purifications. Error bars are standard errors (n=5).

